How it works
Map it. Score it.Rank it. Decide.
Scopewell does not guess your priorities. You map and score your own processes. The platform ranks the roadmap.
Why a method matters
A roadmap is not a slide deck.
Three ways AI roadmaps go wrong, and how Scopewell fixes each one.
You get a list of automation ideas, but nothing tells you what to do first.
Scopewell ranks every idea by its return, so the order is clear.
The scoring sits in one consultant's head, and no one else can check it.
Your own team does the scoring, and anyone can see how each score was set.
A slide deck ignores which processes are fragile or stuck waiting.
Scopewell measures fragility and waiting time, so the plan reflects real risk.
Scopewell exists because none of these are acceptable when AI decisions compound.
On the platform
Your roadmap,rendered as a plan.
Every ranked line becomes a transformation or project on one timeline. The same view your executive committee reads end to end.
Transformations
Strategic initiatives aligned with company vision
Marketing Process Automation
In Progress · 2 projects
Invoice capture automation
Approval workflow redesign
Profitability Initiative
Planning · 2 projects
Margin analytics dashboard
Pricing engine rollout
Customer Onboarding Overhaul
Draft · 2 projects
KYC document pipeline
Self-service portal
Quarterly close acceleration
MediumThe method
Four steps. One ranked roadmap.
Map
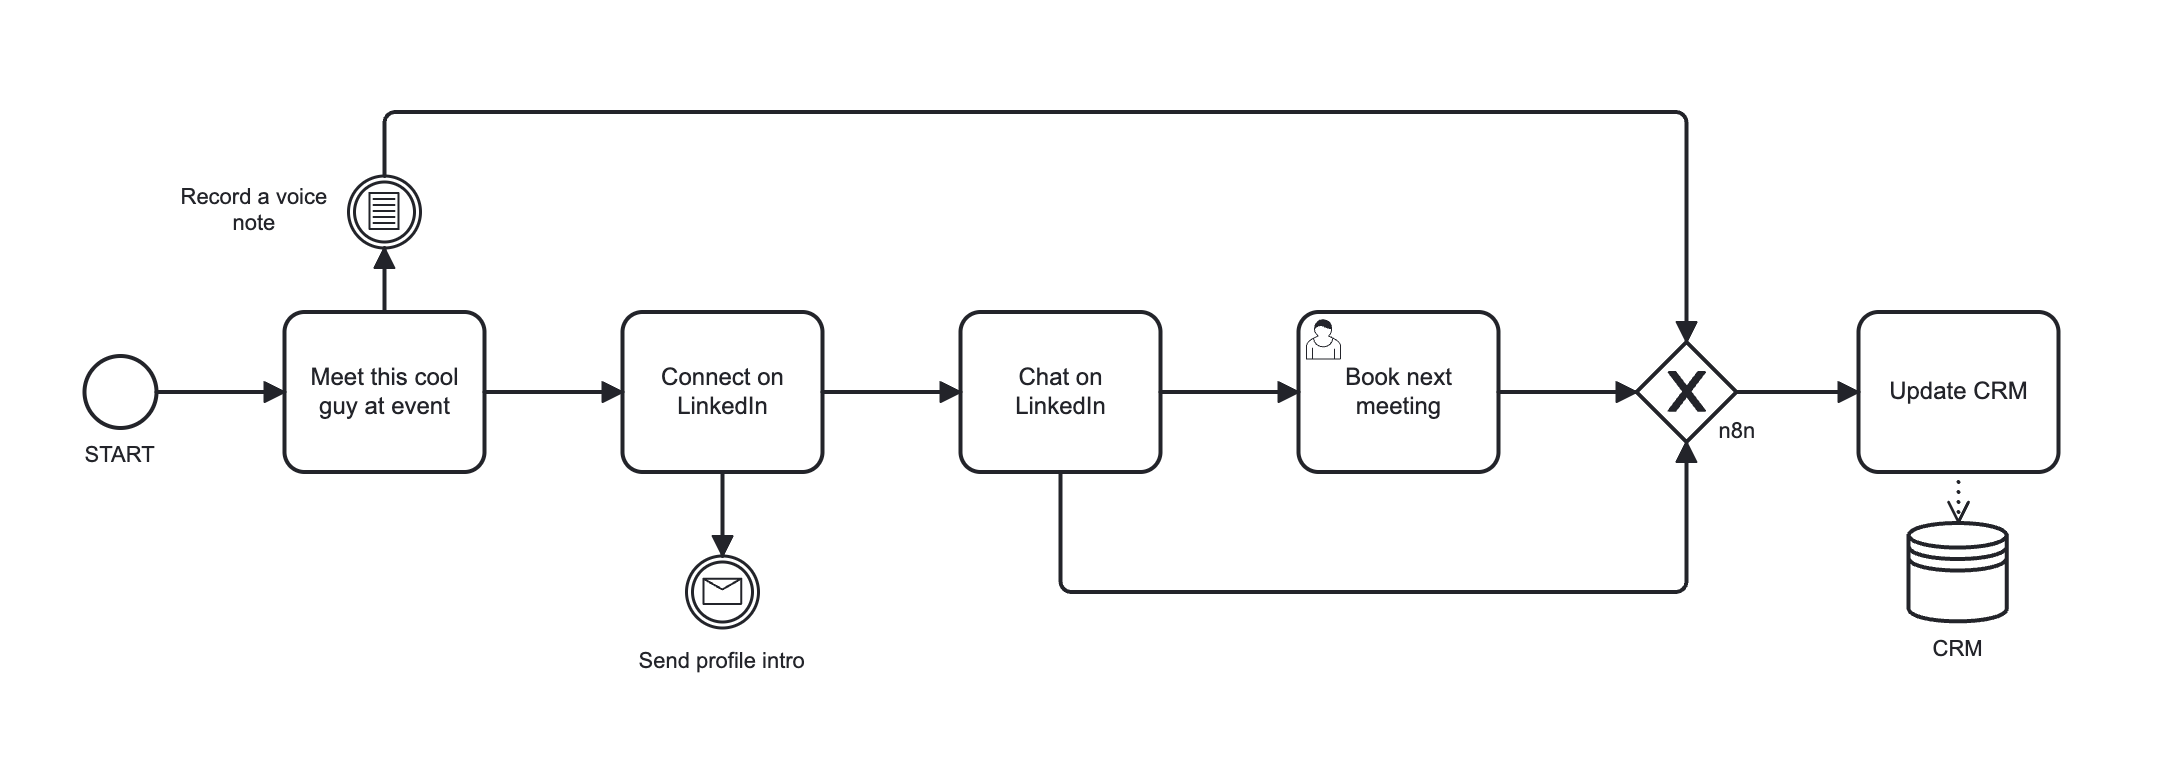
You draw each process in BPMN 2.0. Upload, conversation, or blank canvas. One process at a time.
Score
You rate each process across seven signals. No auto-scoring. The people who run the process do the scoring.
Rank
The platform computes potential, fragility, waiting ratio, and diffusion, then orders processes into three horizons. Now, next, later. Explicit and reproducible.
Decide
The roadmap goes to the executive committee with scoring evidence behind every line. Decisions are defensible.
Process intelligence
From scores to a decision in two views.
The same scoring data renders as a company-wide maturity radar and a prioritization quadrant. Read the gaps, then act on the candidates.
Digital Maturity Radar
Company-wide averages across 32 processes (0–5 scale).
Prioritization Quadrant
Time saving vs. fragility. Bubble size = failure pressure.
What you get
A roadmap your board can read in ten minutes.
Horizon 1
Now
Zero to six months. Quick wins. Payback under six months. Low implementation risk.
Horizon 2
Next
Six to eighteen months. Structural automation. Higher payback, higher coordination cost.
Horizon 3
Later
Eighteen months and beyond. Strategic redesign. Process consolidation and platform shifts.
Deliverables
- Ranked process list with scoring evidence
- Three-horizon roadmap with payback bands
- Recoverable capacity figure in man-months
- Board-ready export in PDF
More than mapping
Three capabilities. One platform.
Project and roadmap view
Every line on the ranked roadmap converts into a defined project. Scope, owner, expected impact, payback band. The roadmap renders as a single visual your executive committee can read end to end.
Process to-be
Map the current state. Then map the target state on the same canvas. Compare the two. The platform highlights what changes, what stays, and where automation removes steps.
AI process advisor
An AI assistant trained on your scored library. It suggests transformation initiatives, recommends sequencing, and challenges weak assumptions. It advises. You decide.
Mapping is the start. These three capabilities turn the map into a decision.
Platform features
Everything the method runs on.
One platform. Grouped by what it does, not by what it sounds like.
Mapping and visualization
Interactive process map
A visual canvas of every process, organized by section and category. Real-time search, color-coded maturity, drag-and-drop layout.
Custom layout, sections and categories
Organize the process map your way. Build custom sections and categories, then arrange processes to match how your organization actually thinks.
Visual BPMN editor
Build and edit flowcharts with tasks, gateways, events, swimlanes, and pools. Drag, drop, zoom, navigate.
Real-time process search
Search every process by name, department, category, or procedure code. Hierarchical, grouped results, instant.
AI assistance
AI chat assistant
Describe a process in plain language. The assistant extracts the steps and builds the BPMN diagram across Discovery, Building, and Review modes.
Image to BPMN
Upload a photo of any flowchart. Get an editable BPMN diagram in one click.
Scoring and assessment
Digital maturity assessment
Rate each task across five dimensions with touch-friendly sliders. Automation readiness renders as a color overlay on the diagram.
Process maturity scoring
Evaluate process governance and quality across five weighted dimensions. The score recalculates in real time.
Scoring grid view
Review and score the whole library from one grid. A fast, at-a-glance table to assess every process in a single pass.
Automation value calculator
Score tasks on frequency, effort, cost savings, and strategic fit to surface the high-value automation targets.
Intelligence and strategy
Intelligence dashboard
Read portfolio performance through radar charts and strategic quadrant positioning. Spot the optimization opportunities.
Strategic alignment
Define your own strategic metrics. Sortable tables show which processes align with company goals.
Roadmap and projects
Track transformation projects, link processes to initiatives, and monitor progress along the automation roadmap.
Voice AI assistant
Coming soonTalk to the AI in real time to create and modify diagrams hands-free, with automatic transcription.
Data and integration
Bulk process import
Upload a CSV to import many processes at once, with column mapping and automatic department and category creation.
BPMN import and export
Bring in BPMN or XML files from other tools, or export your diagrams for external systems.
Governance and administration
People and task management
Assign tasks to team members, track status and priority, and manage a central person directory across every process.
Audit and compliance
Track every process change with full audit logs, historical versions, and user attribution.
Subscription and usage
See your plan, AI quotas, and process limits with real-time usage indicators in the sidebar.
SOW and RFP builder
Coming soonGenerate statements of work and requests for proposal straight from your processes and prioritized initiatives.
What we do not do
Clarity beats over-promising.
What Scopewell does
- Maps processes in BPMN 2.0
- Scores automation potential and fragility
- Ranks a three-horizon roadmap
- Quantifies recoverable capacity
- Exports a board-ready roadmap
What Scopewell does not do
- Auto-score processes without user input
- Replace your CRM, ERP, or PM tools
- Implement the automations for you
- Audit your IT stack or licensing
- Deliver a 200-slide consulting deck
We do one thing. We do it precisely.
Built on BPMN
International standard. No proprietary lock-in.
Scopewell maps every process in BPMN 2.0, the ISO/IEC 19510:2013 international standard for process notation. Three consequences matter.
Your library is portable.
Diagrams open in any BPMN-compliant tool. The IP stays with you.
The scoring is reproducible.
Any operations lead can read a diagram and verify the inputs. No black box.
The library compounds.
Each scored process becomes a reusable asset across audits, training, and onboarding.
Questions
Common questions, direct answers.
Ready to start?
Stop guessing. Start planning.
You already have the processes. You already feel where the pain is. Plug one real process into the app. See the score in fifteen minutes.